Making Maps in Kepler.gl
Contents
Making Maps in Kepler.gl#
Today we’ll learn how to build three different kinds of maps that answer different research questions:
We will use our bushfire dataset to build these maps.
1. Getting the data#
Today we’ll work with the bushfire dataset. This can be downloaded using the following link: Link to bushfire dataset
Click on the download icon at the top-right hand corner of your screen. You should see ‘Bushfire_Dataset.csv’ in your downloads folder.
Open a web-browser and navigate to Kepler.gl
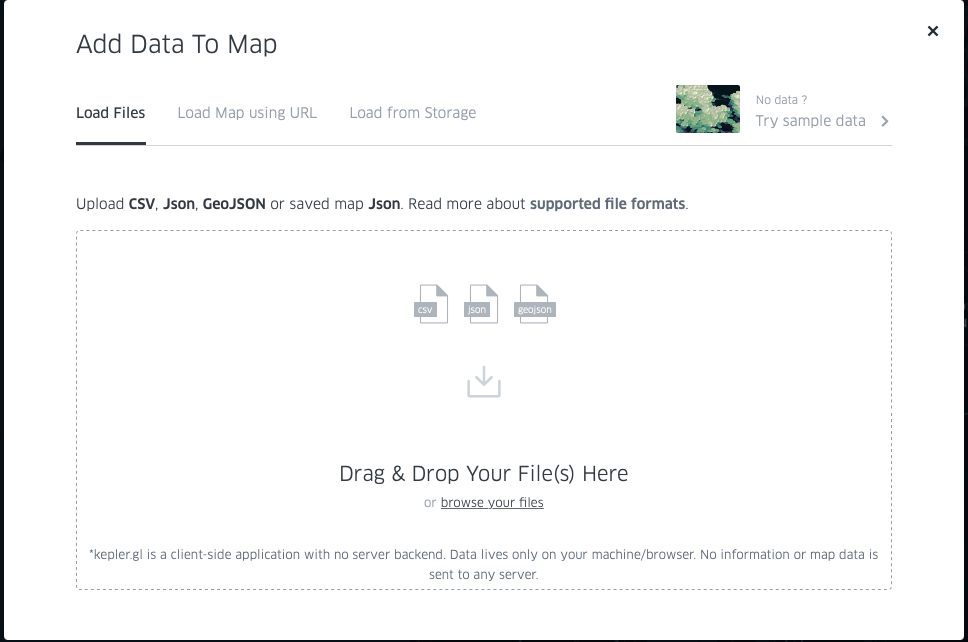
Click ‘get started’ and click on the ‘browse your files’ link once you see the pop-up below. Navigate to your Downloads folder and upload ‘Bushfire_Dataset.csv’ to Kepler.gl.
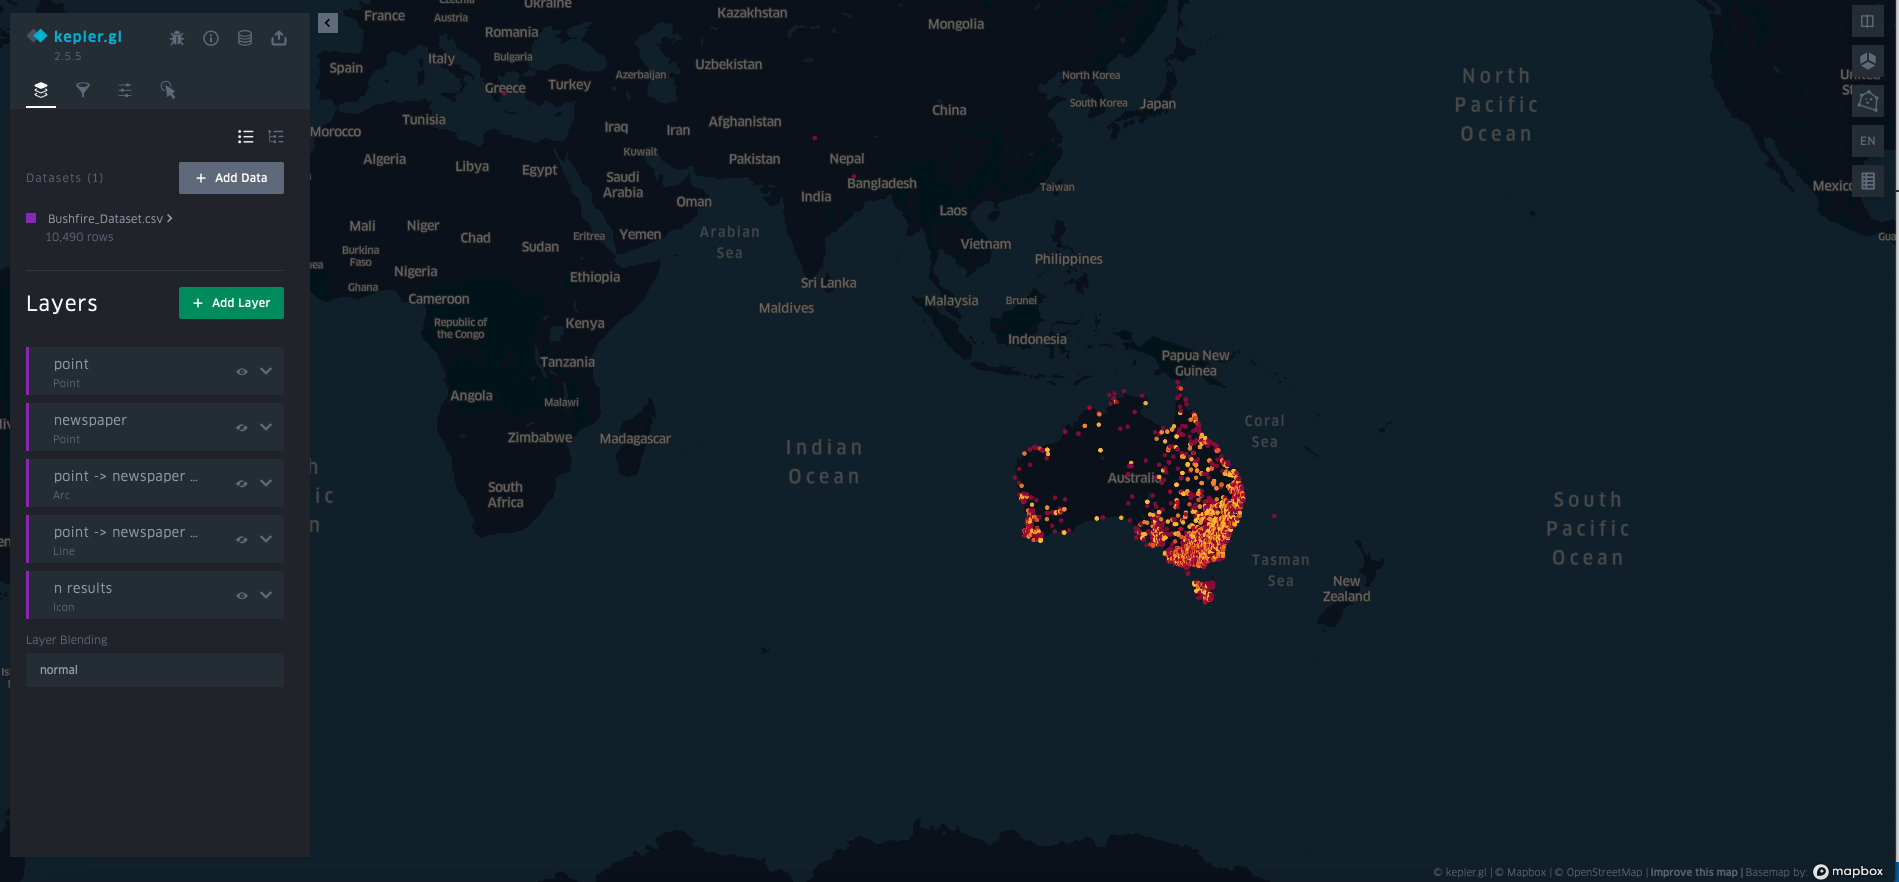
Kepler will automatically read the csv document to identify information about latitude and longitude and then visualise these points on the map canvas. Your map should look like the screenshot below.
Getting Used to the Mapping Interface
You’re probably familiar with other mapping interfaces such as Google Maps. Take a moment to familiarise yourself with the functionality of Kepler.gl. Trying zooming in and out. Try hovering over one of the points, what information is shown?
2. Making a Time-Series Map#
The first map we wils make is a time-series map, we will also enable some functionality to improve the legibility of the data.
Step One: First, let’s explore our dataset.
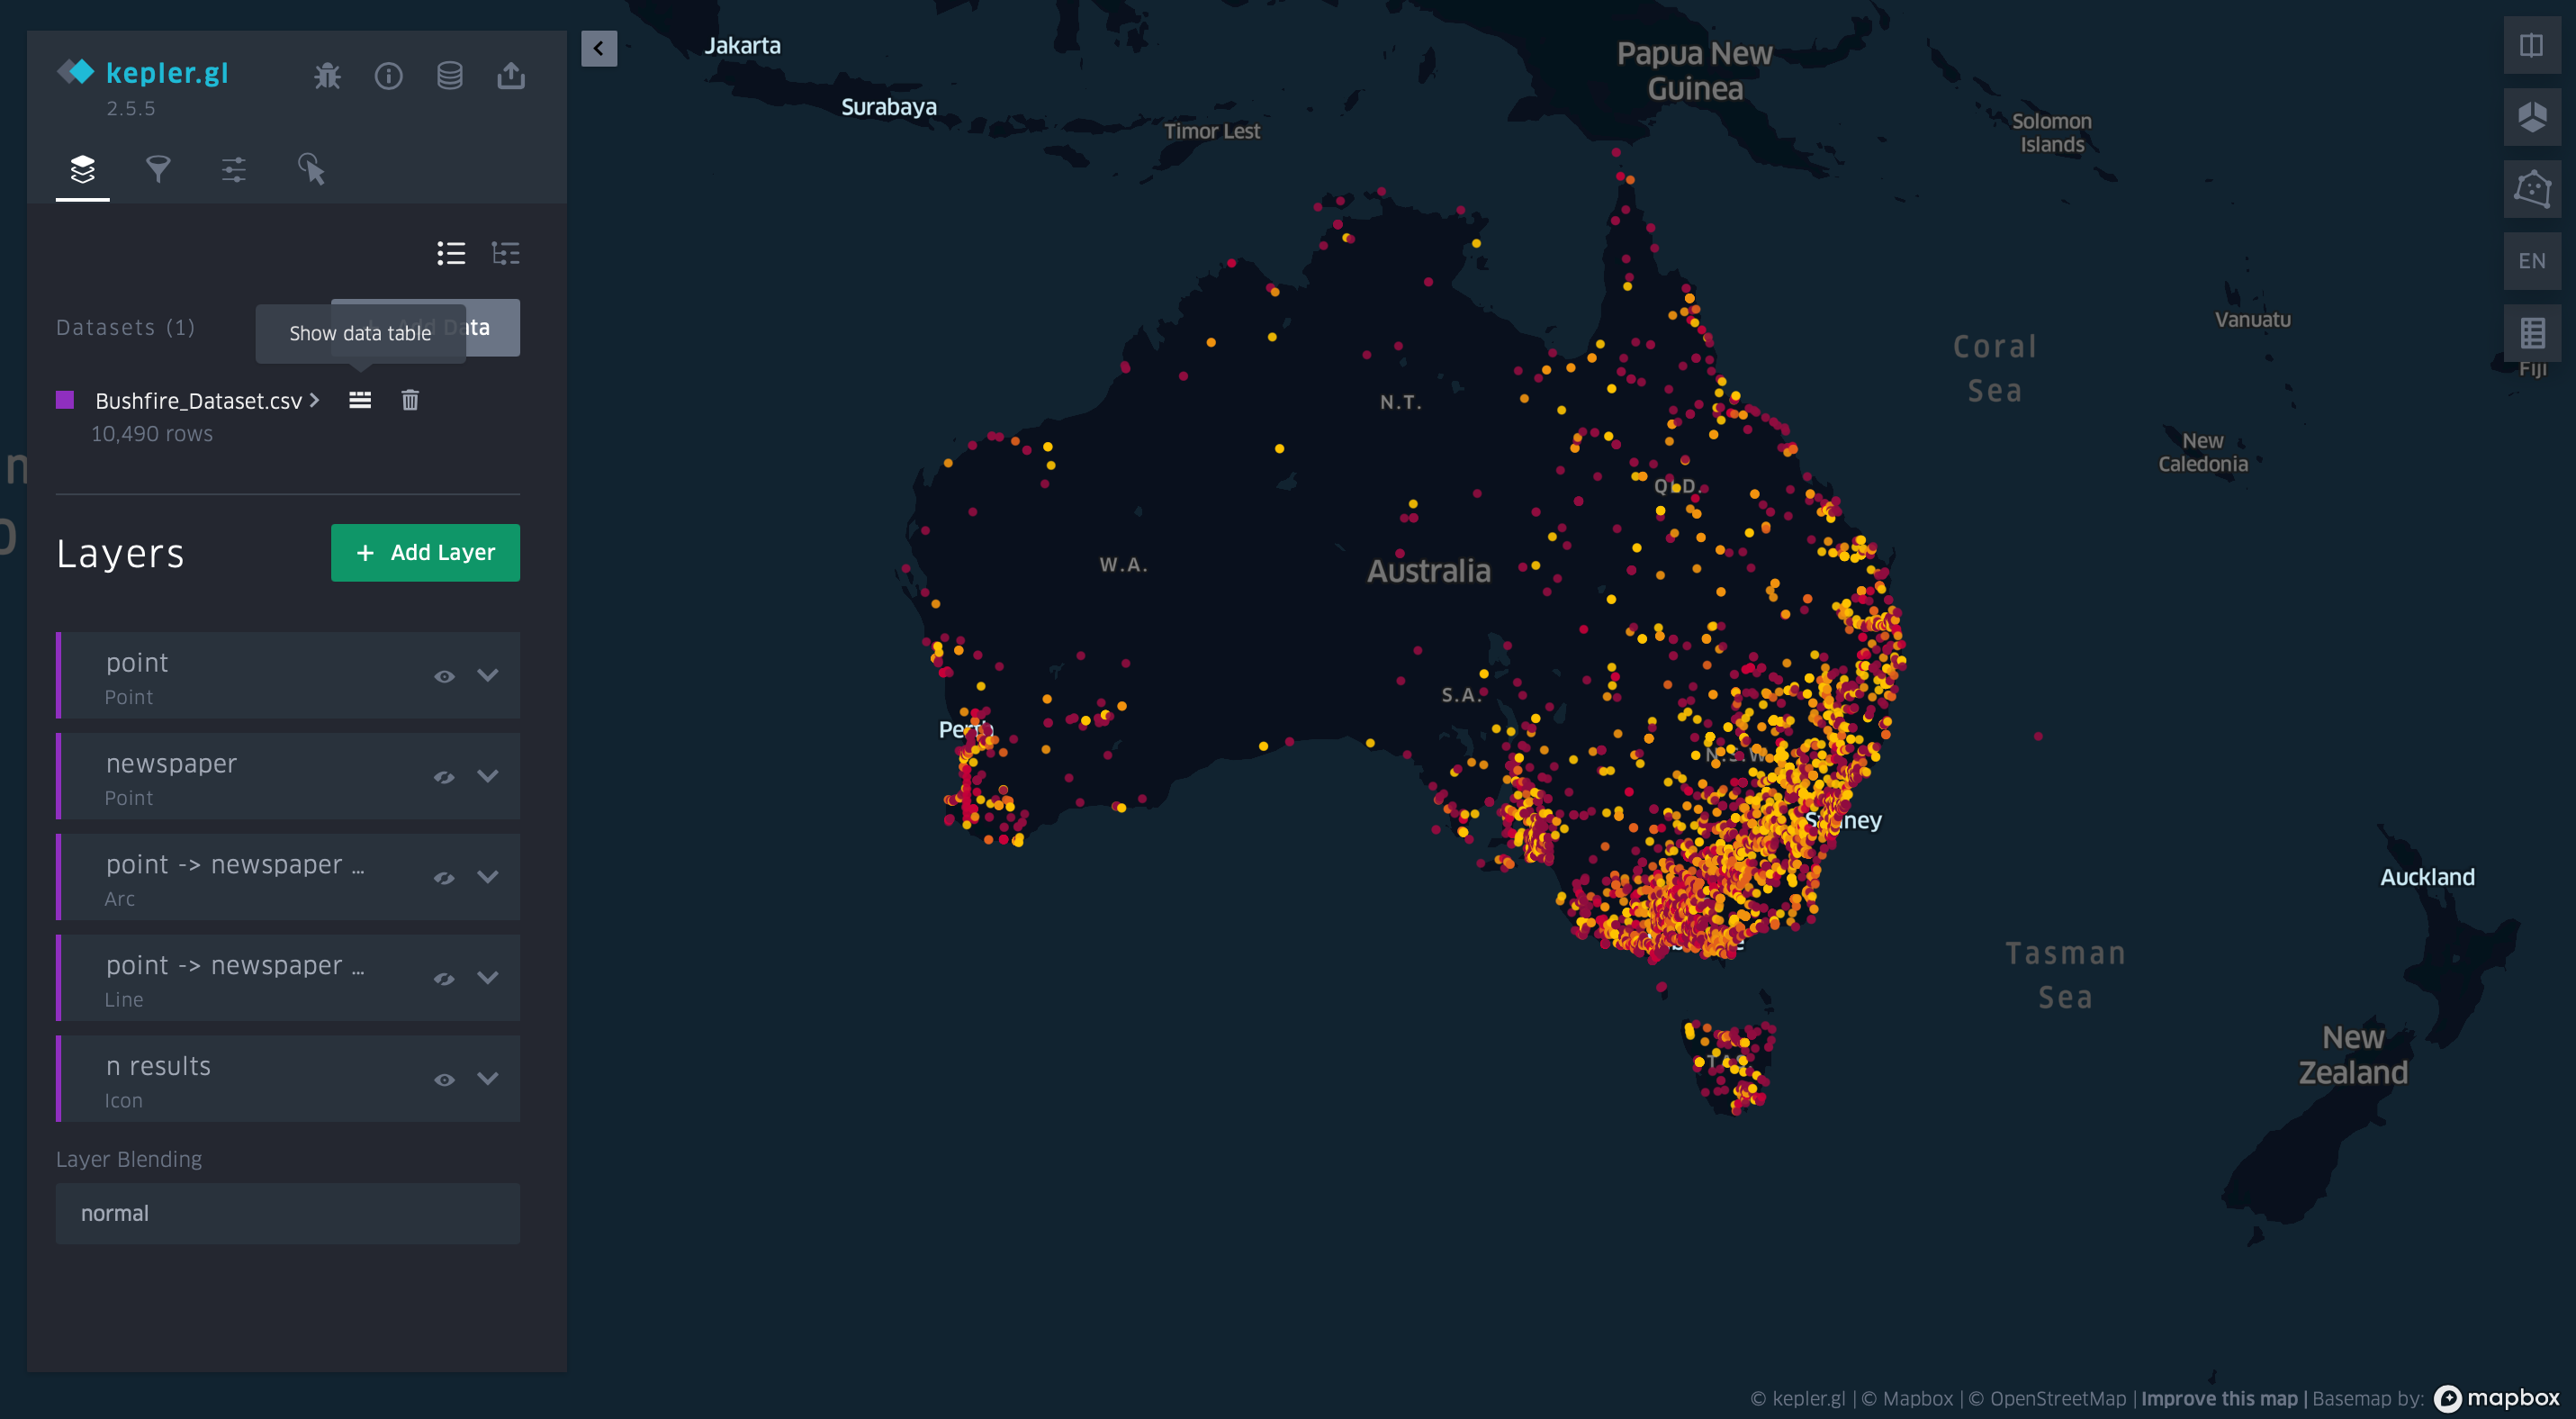
Click on the Layers icon in the toolbar (it’s the icon with the stacked diamonds).
Hover over the item ‘Bushfire_Dataset.csv’ underneath the ‘Datasets’ heading. You should see see two icons appear: a trash-can on the right and another icon that says ‘Show data table’ Click on this icon.
Step Two: In the first map that we make we want to be able to visualise incidence of bushfires over time, and provide some additional contextual material so the viewer can navigate back to the original newspaper article. The fields that are relevent for our pruposes are:
Placename
Longitude and Latitude
Newspaper
Title
Date
URL
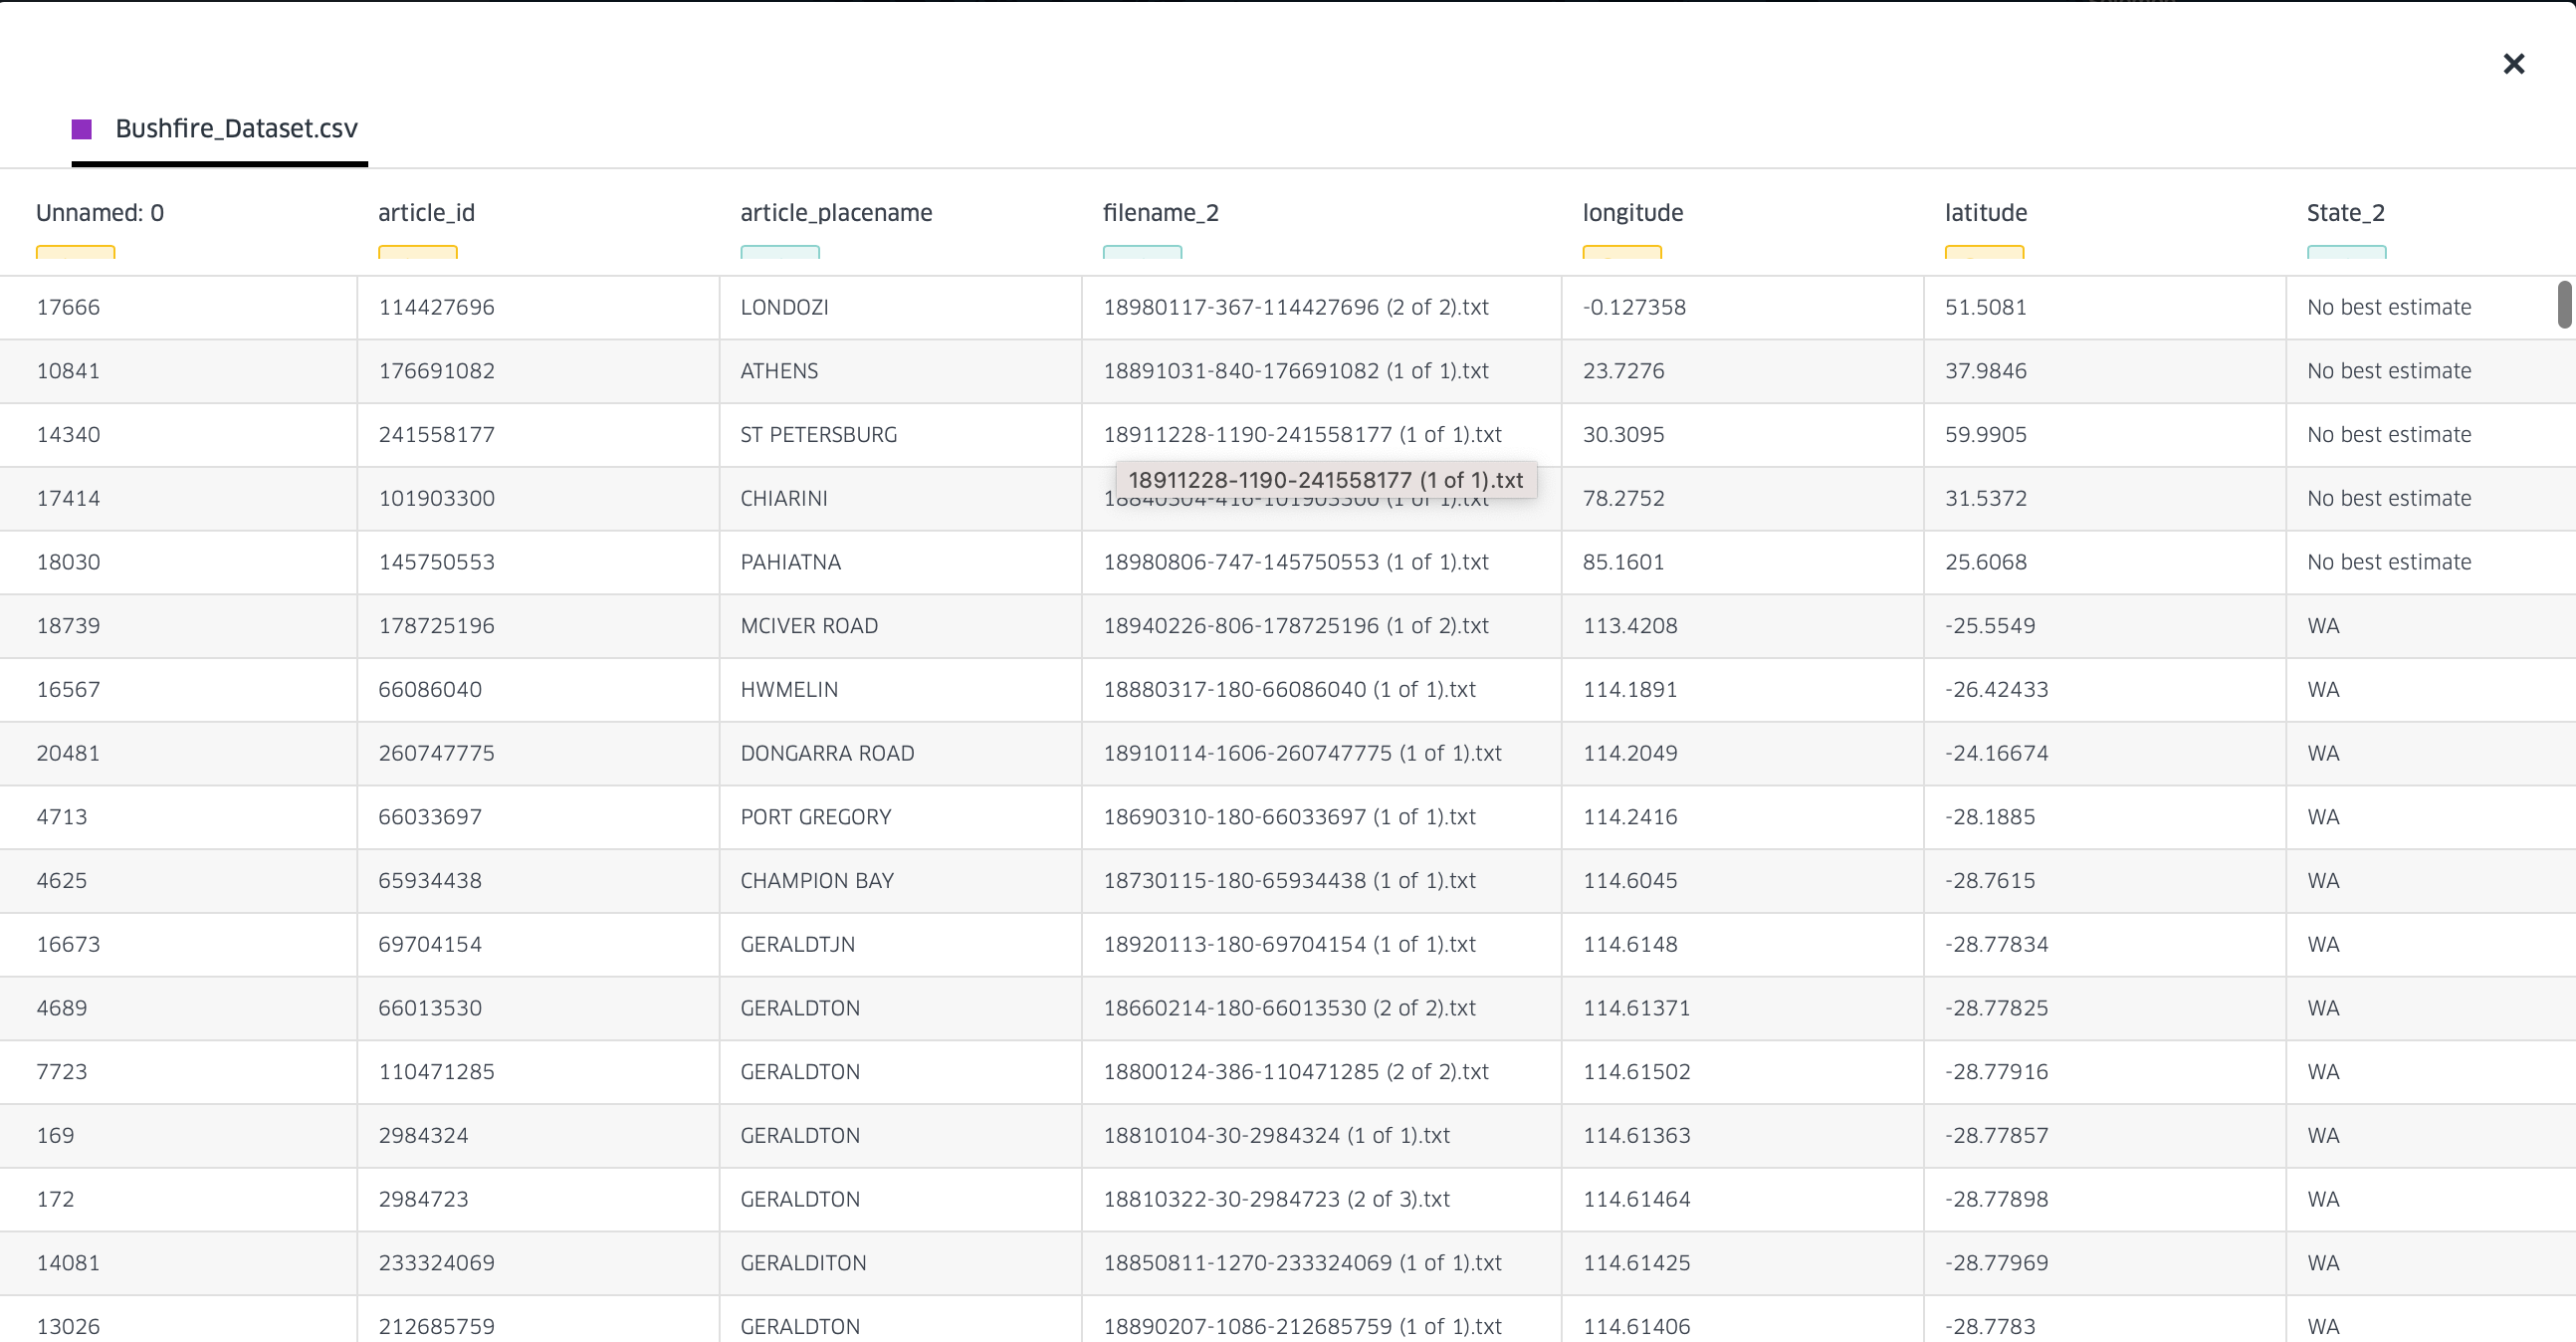
Data Types
You will notice that Kepler.gl has assigned different colours to the column names. This is an indication that it is recognising different data-types. Importantly, the ‘Date’ column is green, this indicates that the data is in the correct date format for visualisation. Kepler.gl is very fussy about the format the format of the time data. Preferably the format should be ‘YYYY-MM-DD 0:00’
Step Three: If we navigate back to the map interface you will see that Kepler.gl has already generated some options for visualisation in the Layers Section.
Navigate to the ‘Interactions’ tab at the top of the toolbar. We can now change what information is displayed on the map by adding and removing variables from the ‘Tooltip’ section. Add the variables: Placename, Newspaper, Date, Title and URL
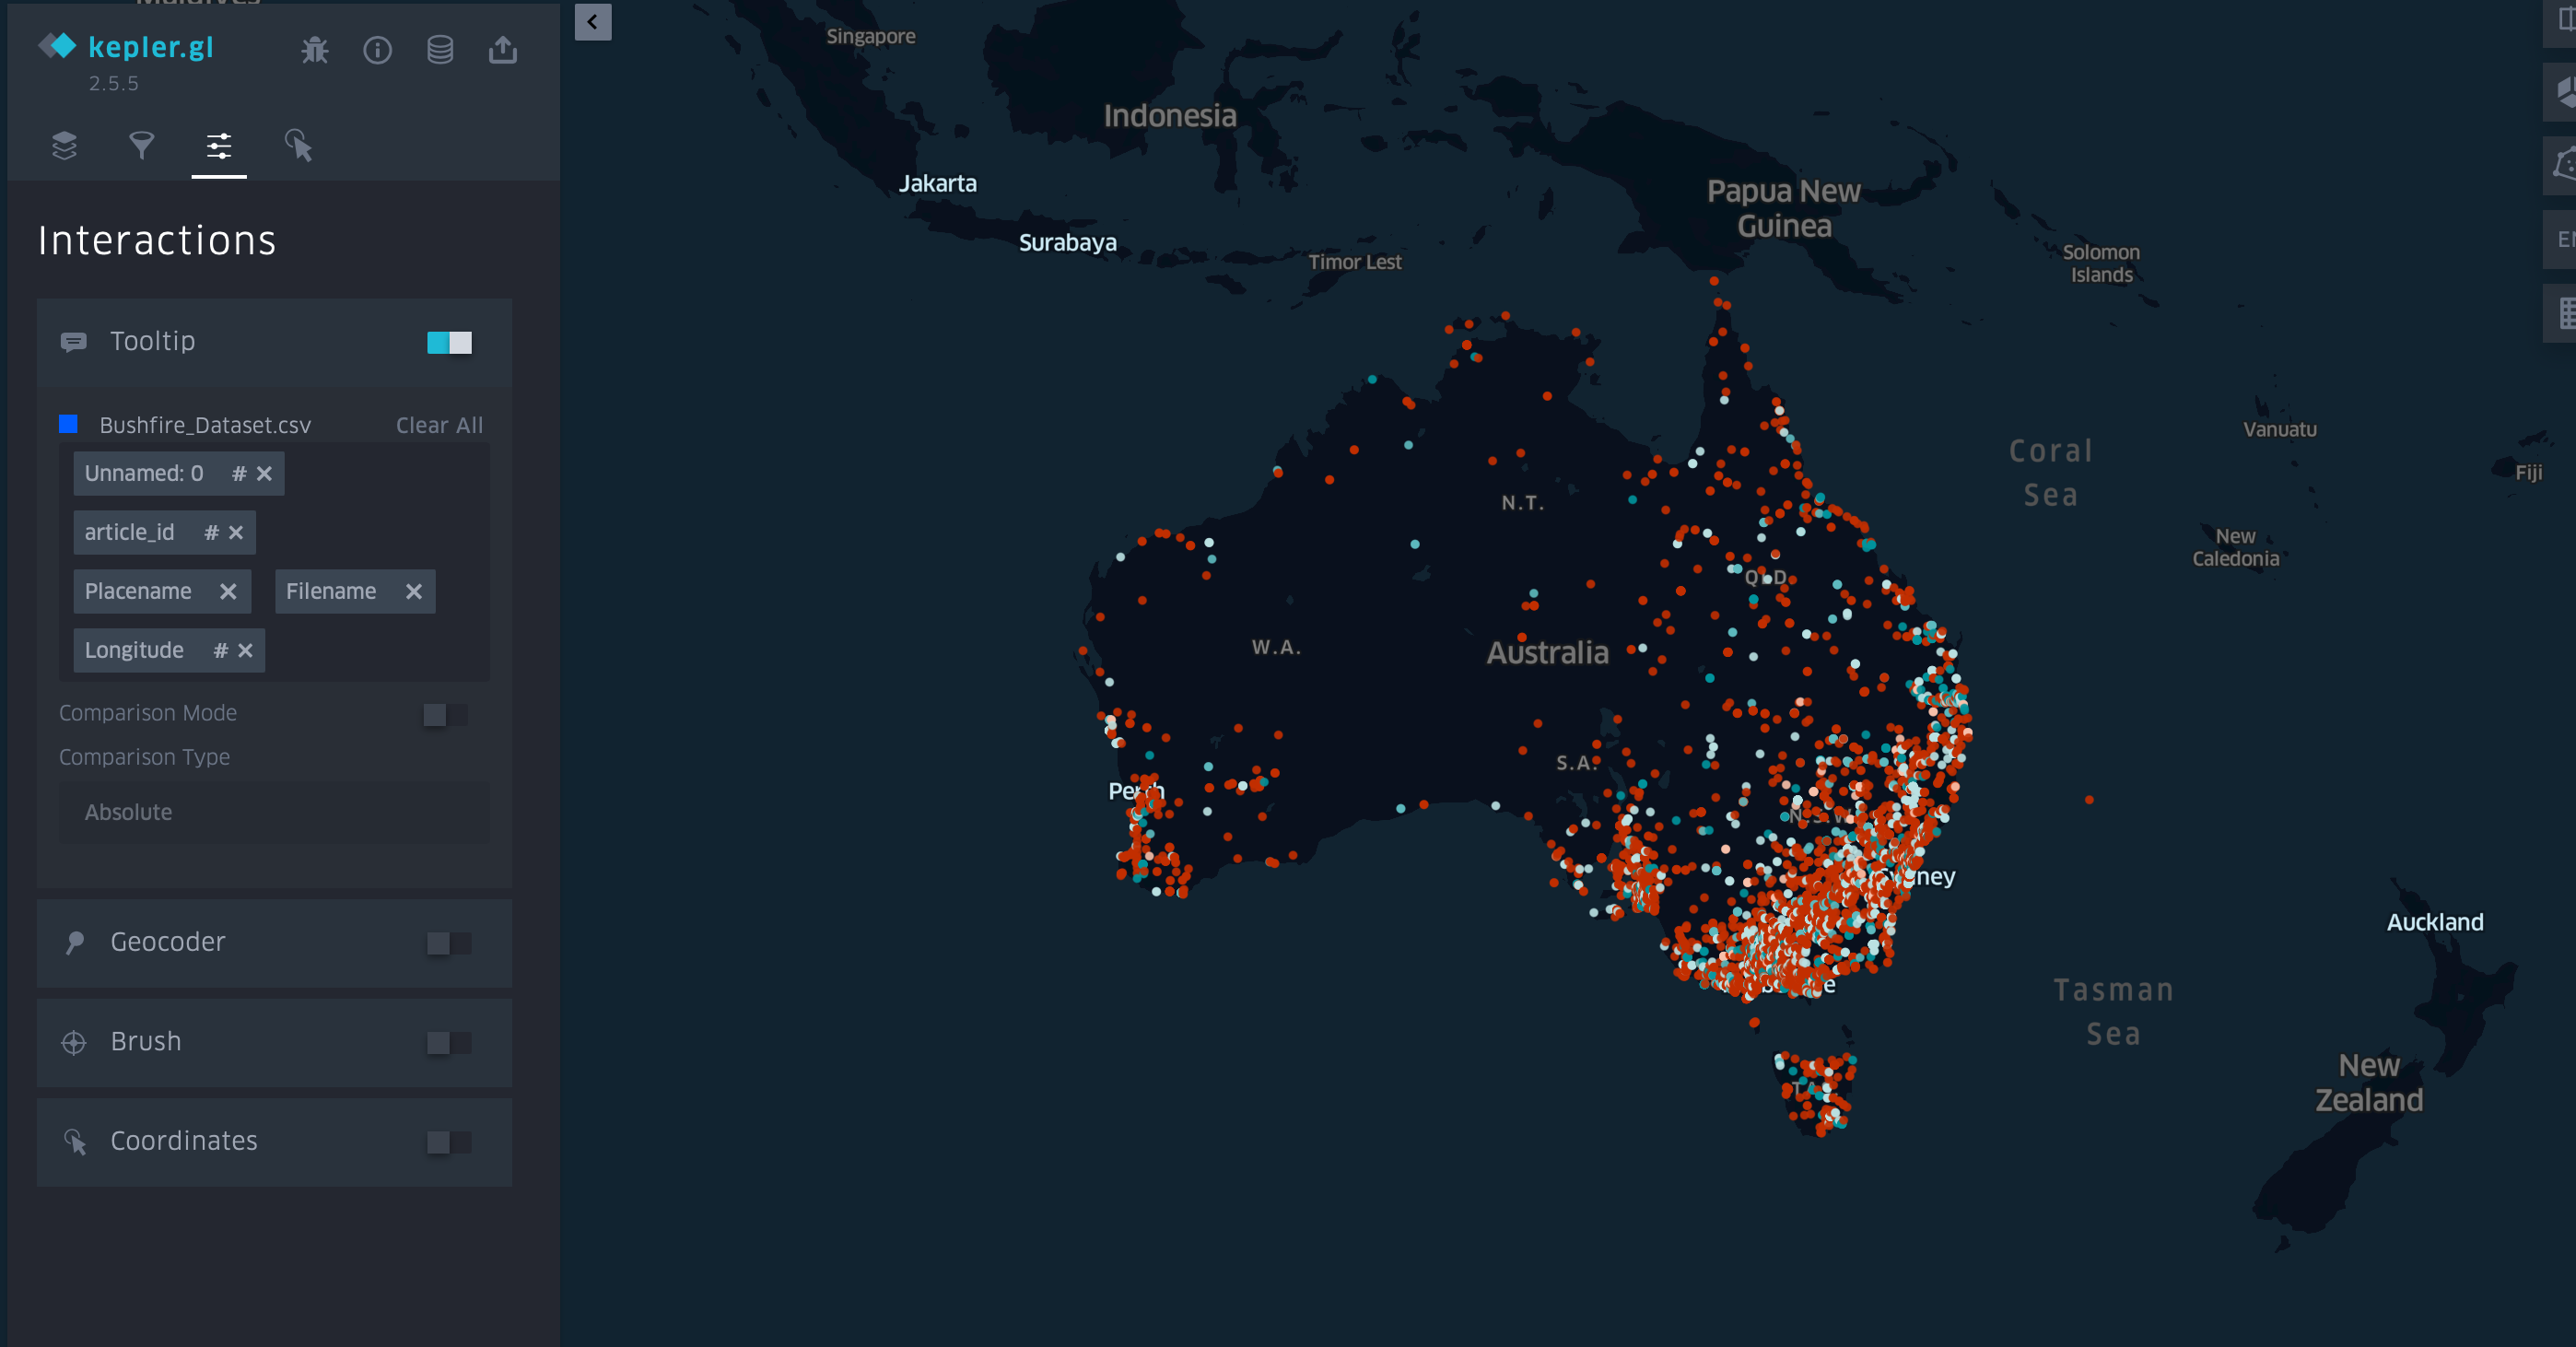
If you hover over the points on the map you will now see our chosen information displayed. The URL has automatically been rendered as a hyper-link and can be used to navigate back to the source material.
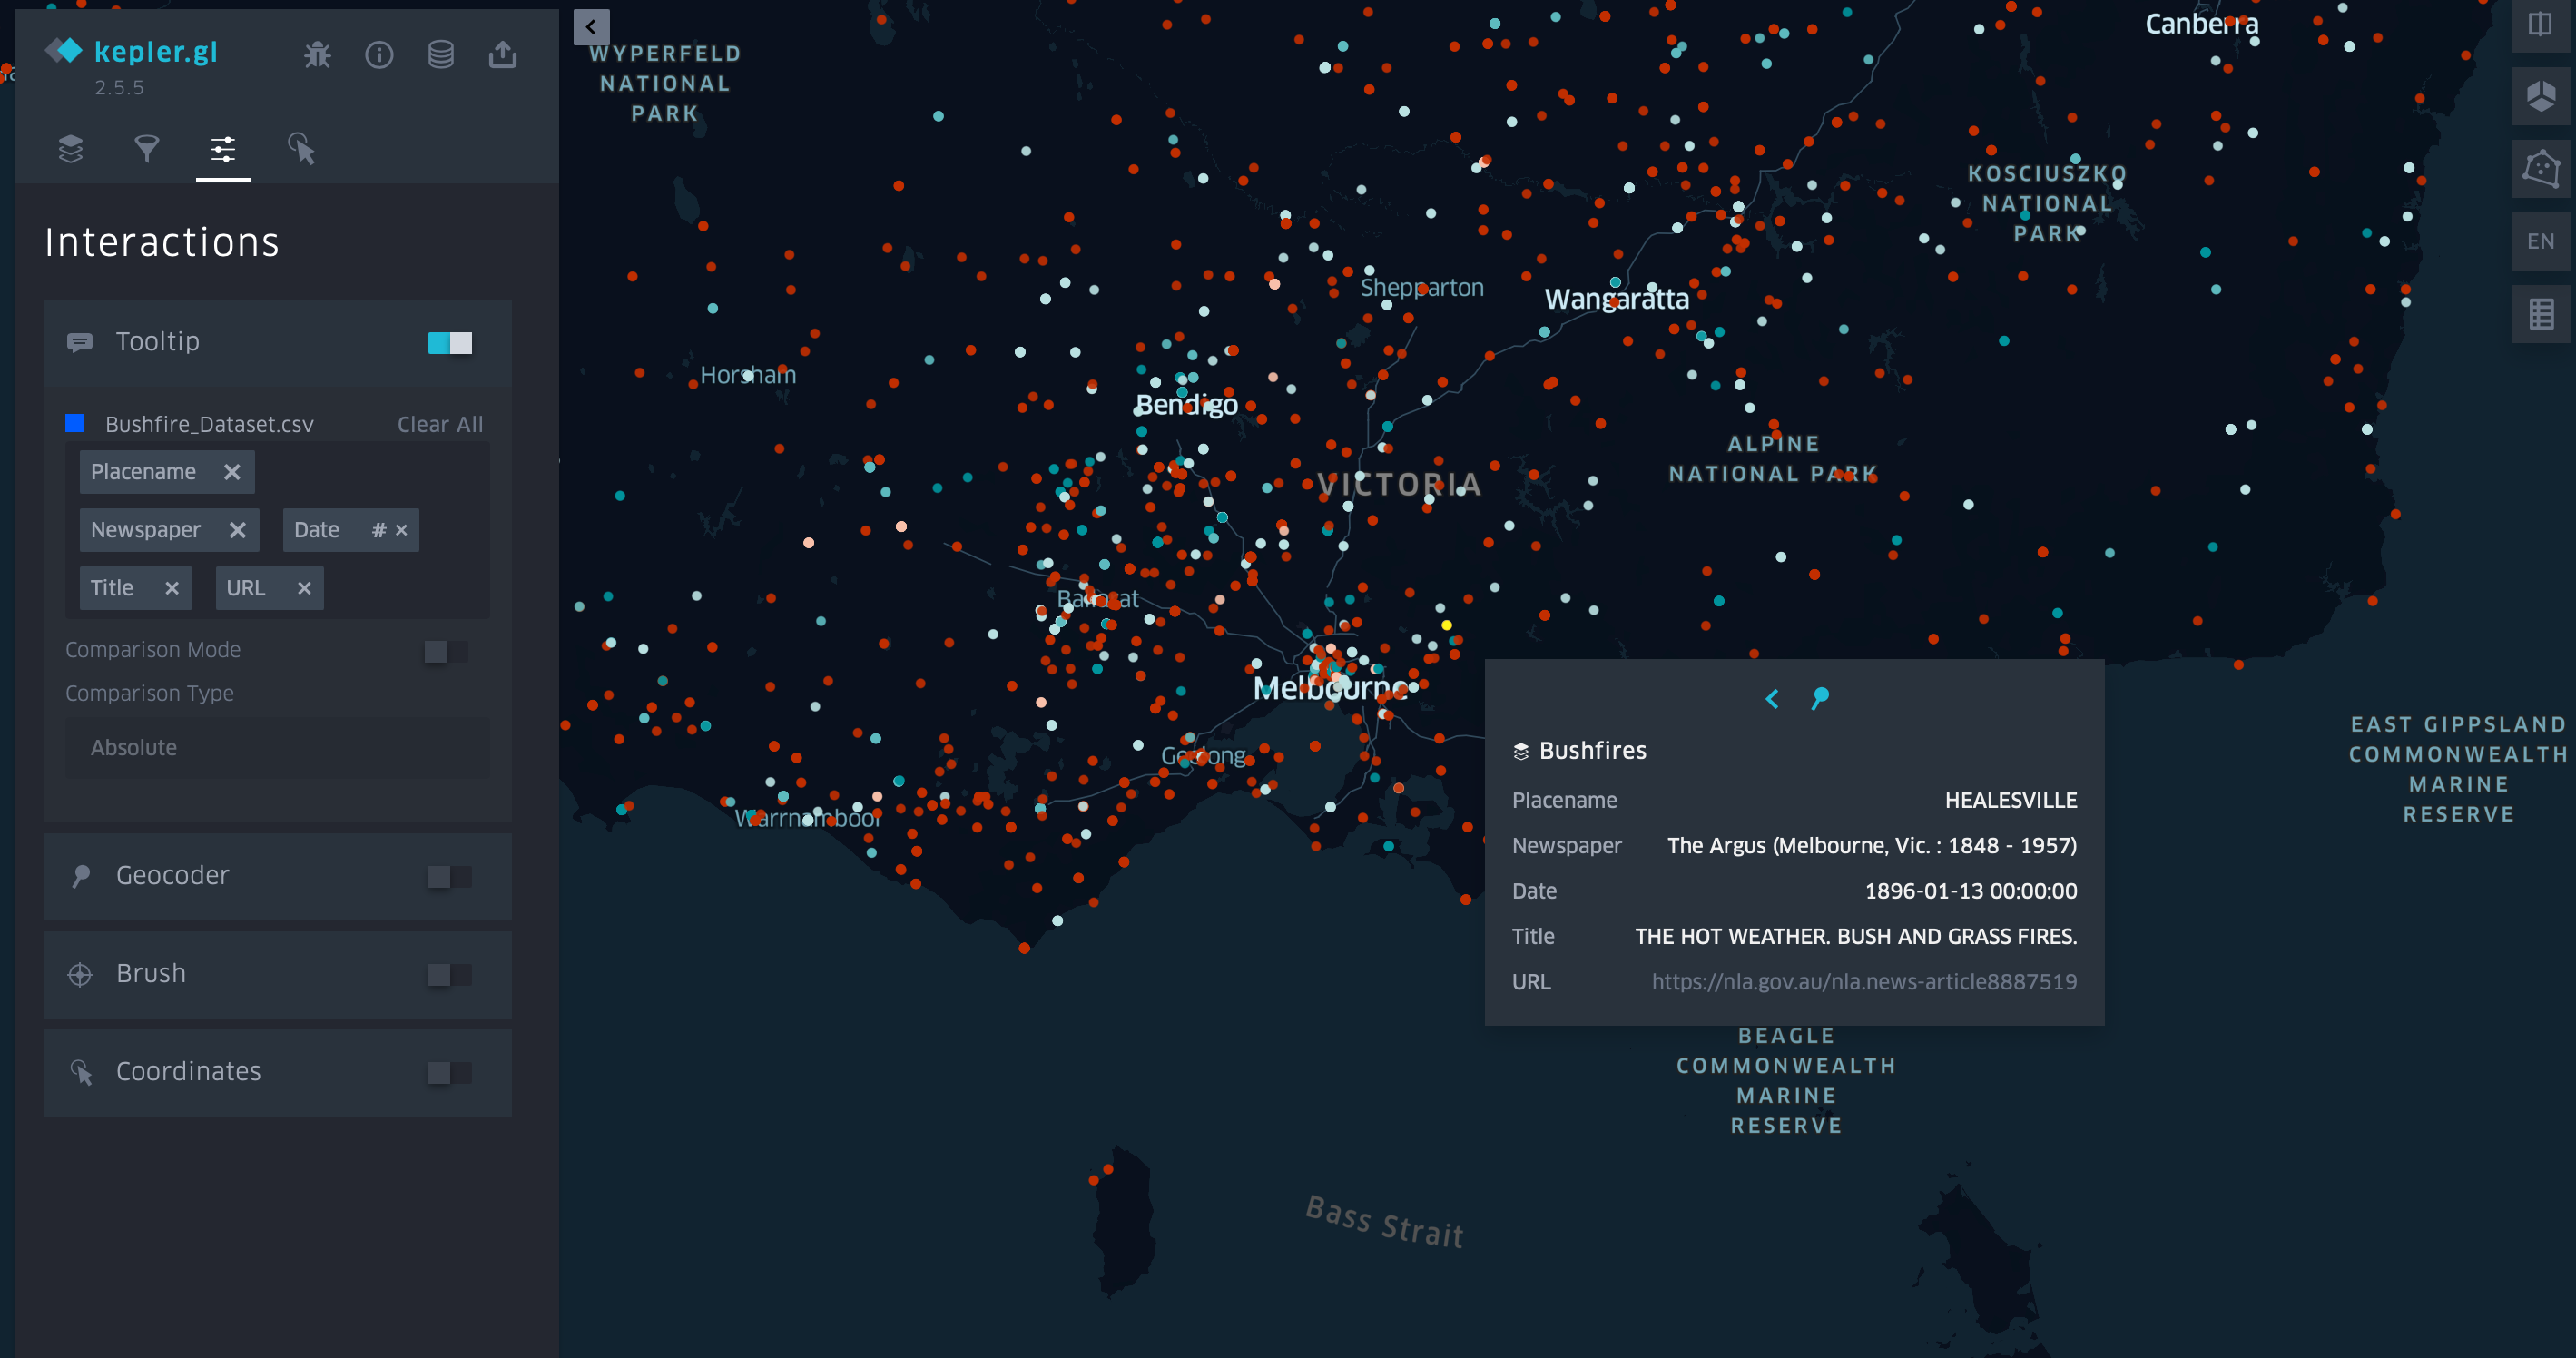
Fig. 1 Image of pop-up on map#
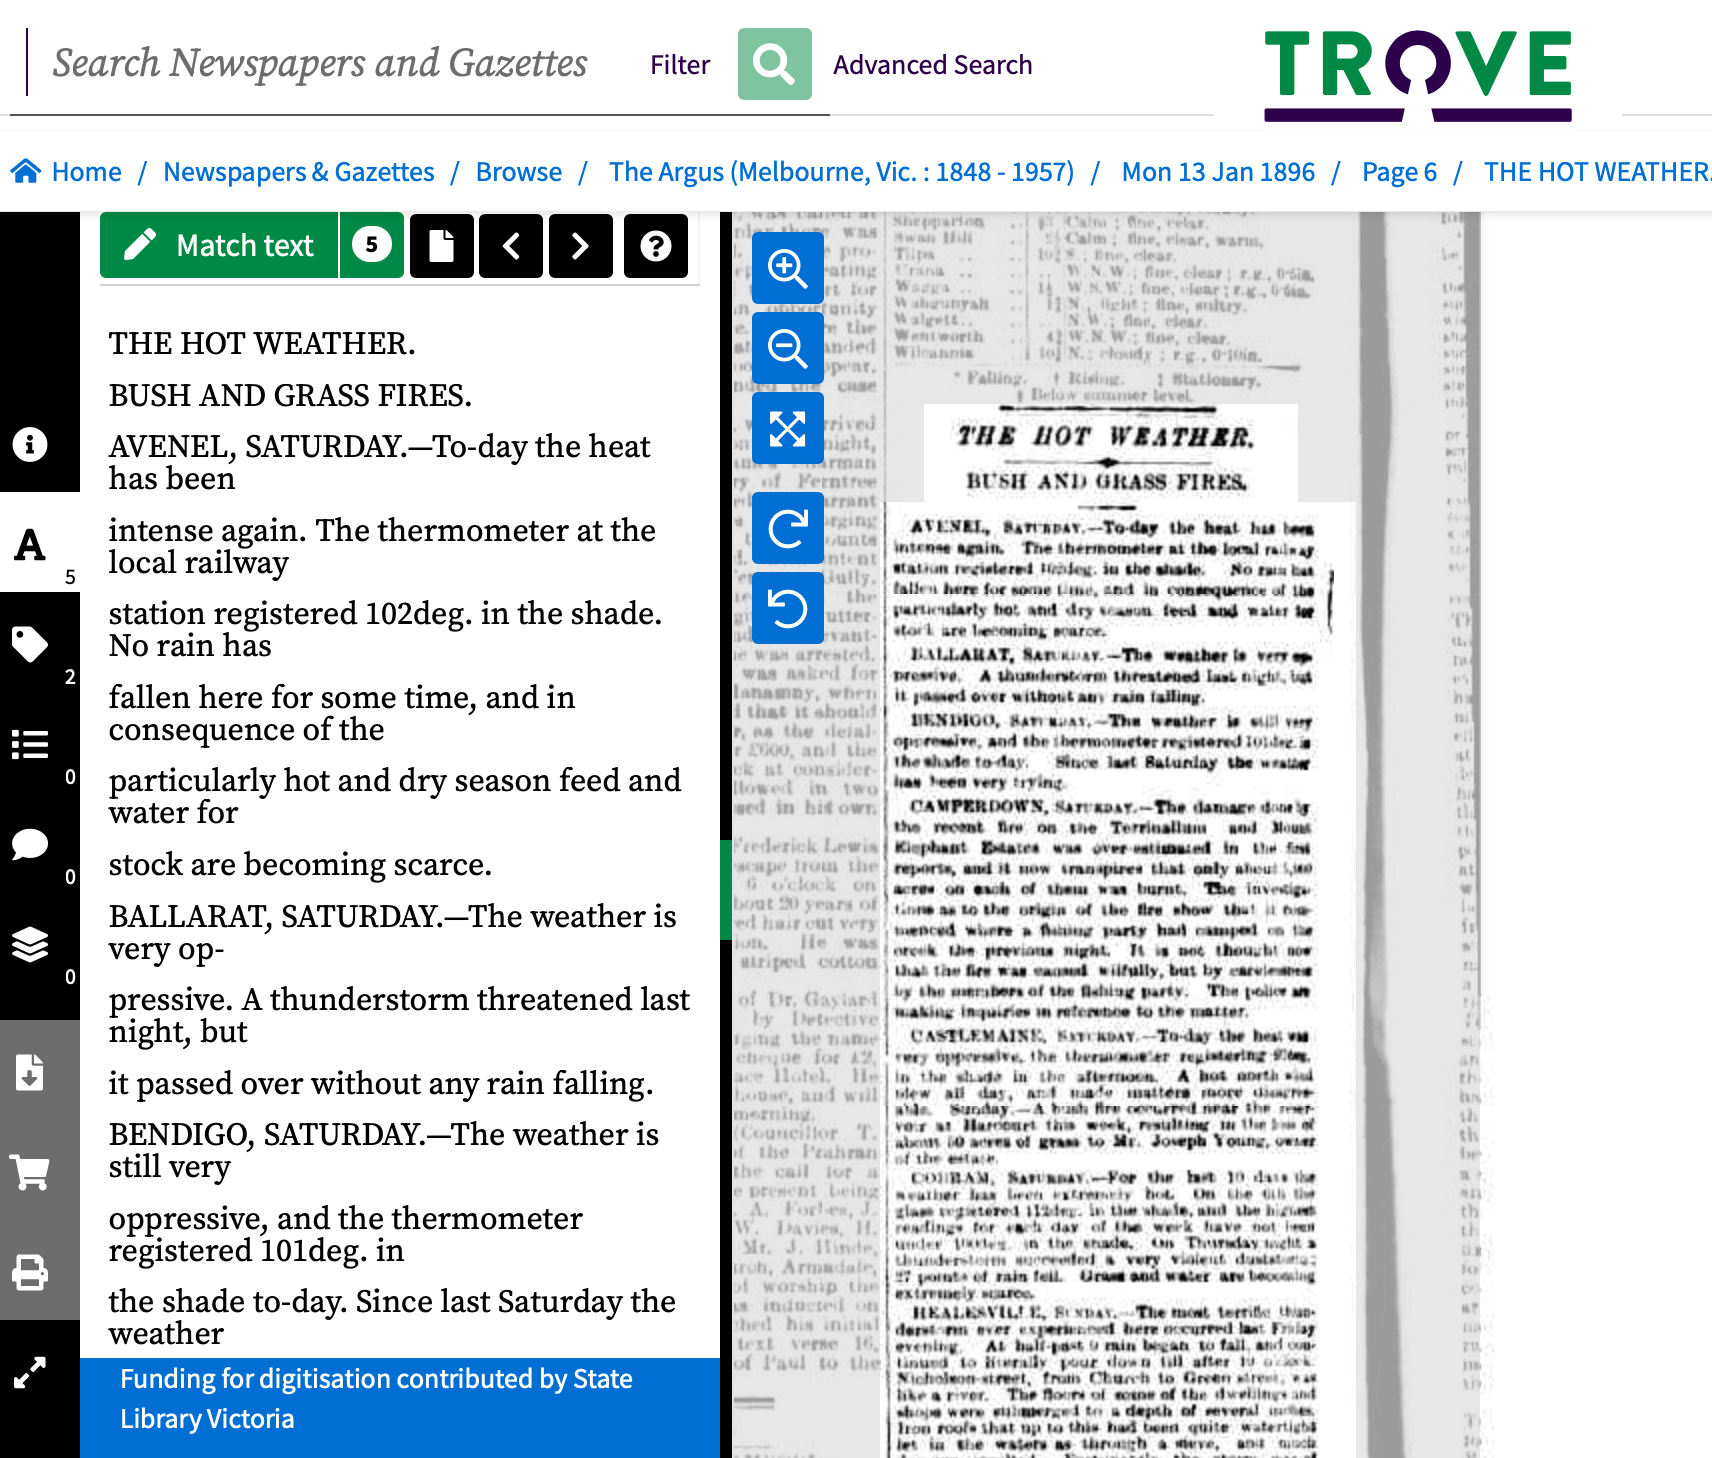
Fig. 2 Link from URL to newspaper article in Trove#
Step Four:
To add a time-line to our map, click on the ‘Filters’ icon at the top of the Kepler.gl toolbar.
Then click on the button that says ‘Add Filter.
Scroll down and select ‘Date’ in the ‘Select Field’ drop- down menu. Once selected you should now see a time-line appear at the bottom of the screen.
To animate the time-line select the play button
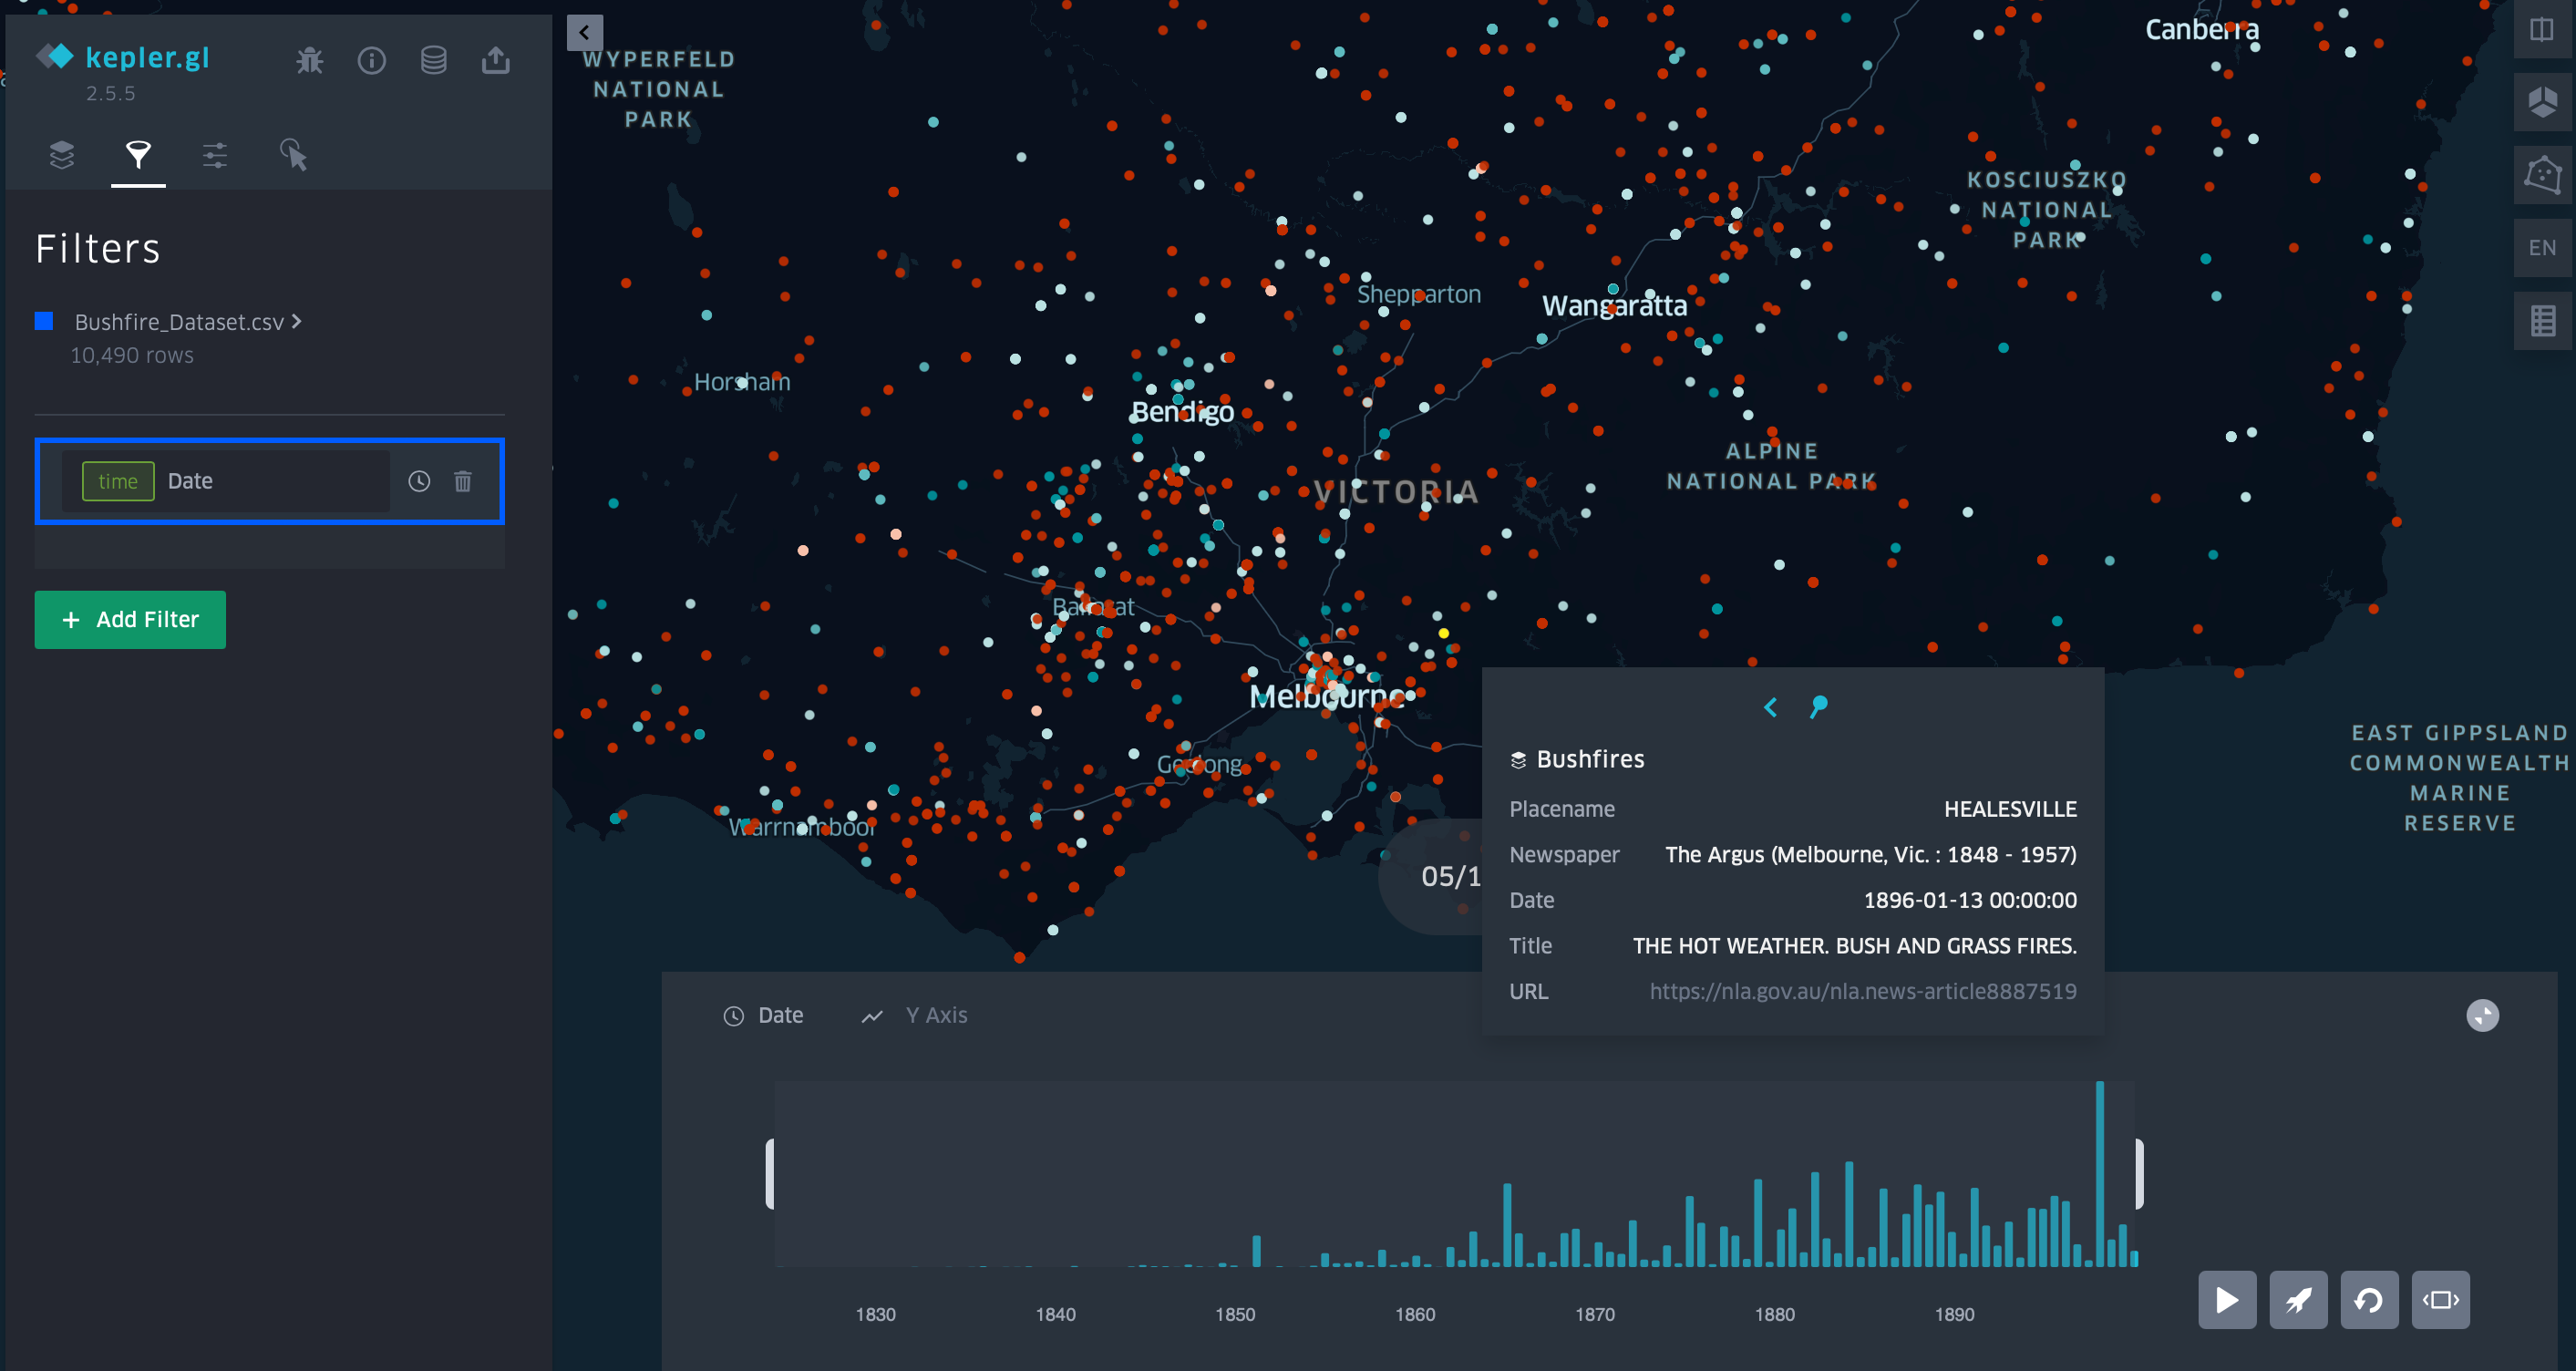
Fig. 3 Timeline#
3. Saving and Sharing your Map#
Downloading and Sharing your Map
Kepler.gl is a client-side application, meaning it is running locally on your computer. In order to save and share our maps we are required to take a few extra steps. Kepler.gl allows you to download your map in the following formats as a JSON file or an HTML file.
3.1 Saving your Map#
Click on the Share icon at the top of the toolbar then click on Export Map
Download JSON: Selecting this option saves bothe the data and the configuration settings of the map. If we wish to make further changes to our map we can load this file directly back into Kepler.gl
Download HTML: Selecting this option converts our map to HTML meaning it can be embedded directly on a website. Once you download the map as HTML you will not be able to make any further changes.
Export Images: Kepler also allows you to take high quality pictures of your map using the Export Image functionality.
Capturing Images of your Map
If you are interested in sharing images your map it is advisable to also download a JSON copy of your map so you can reproduce and make any future alterations as needed.
3.4 Embedding your Map as an iframe#
Using iframe-generator.com you can add the URL you generated above to generate an iframe that can be directly embedded into a website.
4. Making a Network Map#
Starting a New Map
You may want to delete and re-load the dataset at this stage as generating multiple layers with different functionalities can become very computationally expensive!
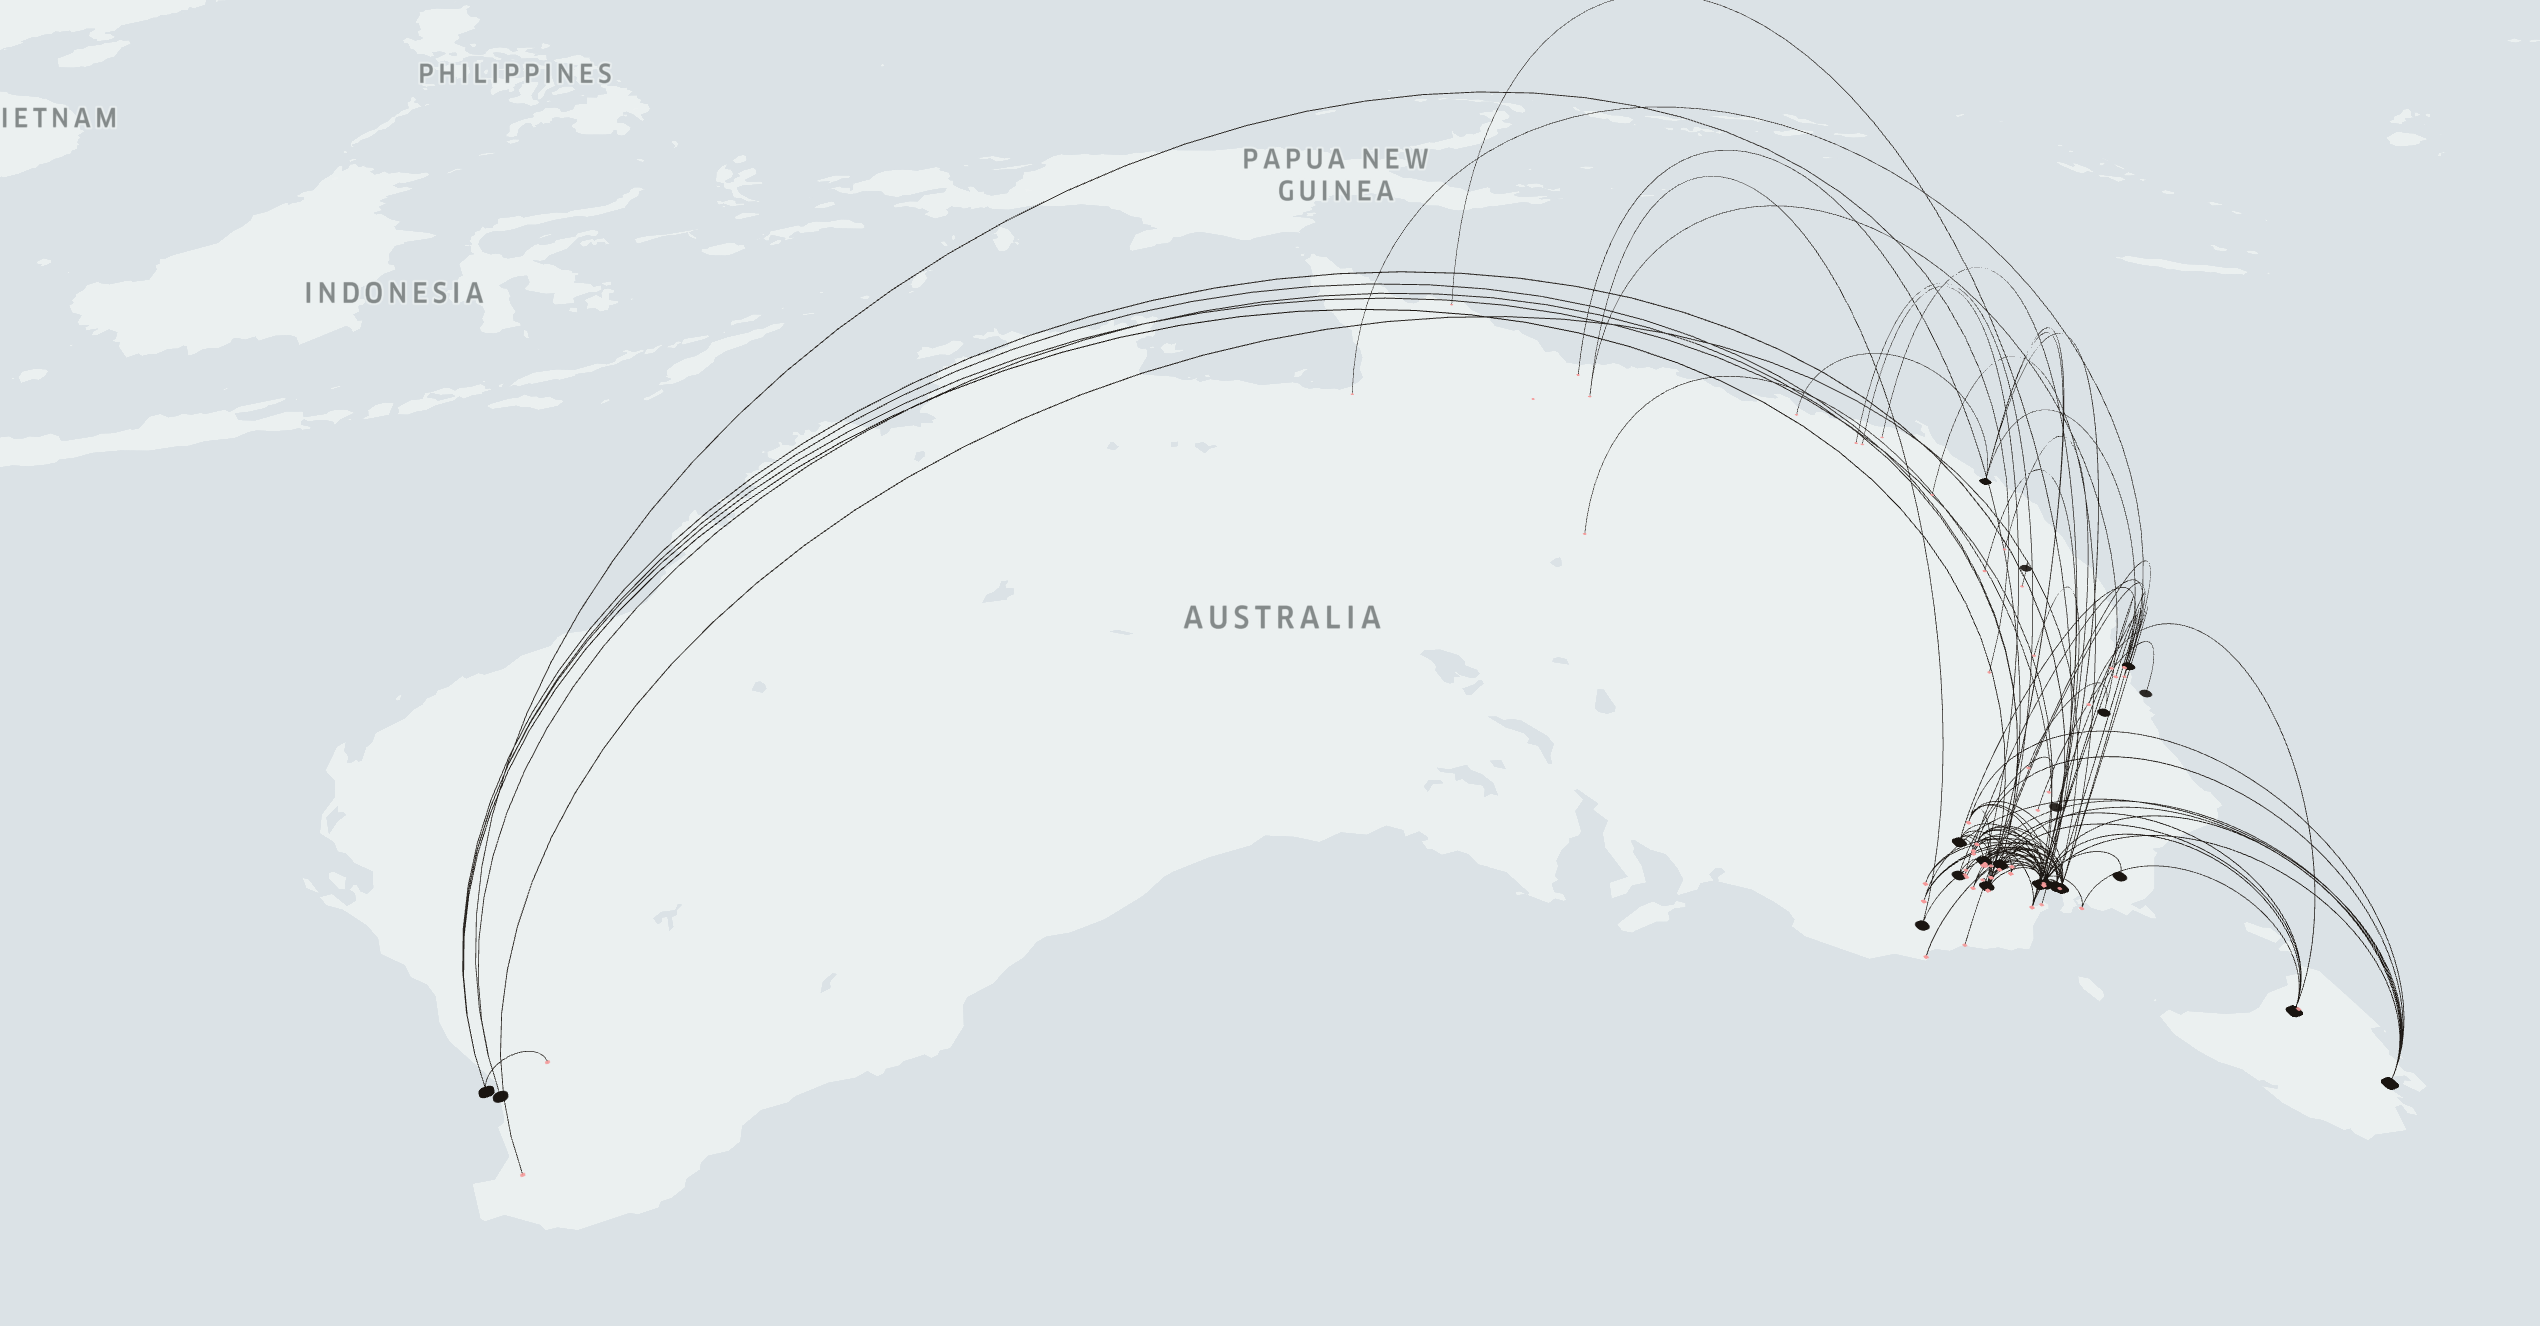
The second map we will make is a a network map.
Navigate back to the Layers tab on the Kepler.gl dashboard. You will notice a number of Layers have already been identified by Kepler.gl.
The third layer down should be titled ‘point -> newspaper arc’. Click on the layer settings icon (small arrow pointing down).
Click on the eye icon to show the layer.
5. Making a Cluster Map#
The last map we will make is a cluster map.
You may wish to begin a fresh map by deleting and re-loading the bushfire dataset. Then click add layer from the Layers tab. A new layer will appear down the bottom of the tool-bar.
Click on layer setting (the little downward pointing arrow) and select Cluster from the first drop-down menu.
Set the latitude and longitude columns from the dataset as the lat and lon column inputs for the map. Some cluster should now appear!
Can’t see your data?
If you can’t see your data make sure the layer is visible in the map settings. There’s a little icon of an eye that should not be crossed out.
Play around with the radius settings for the clusters. To challenge yourself add a time-series to the map.
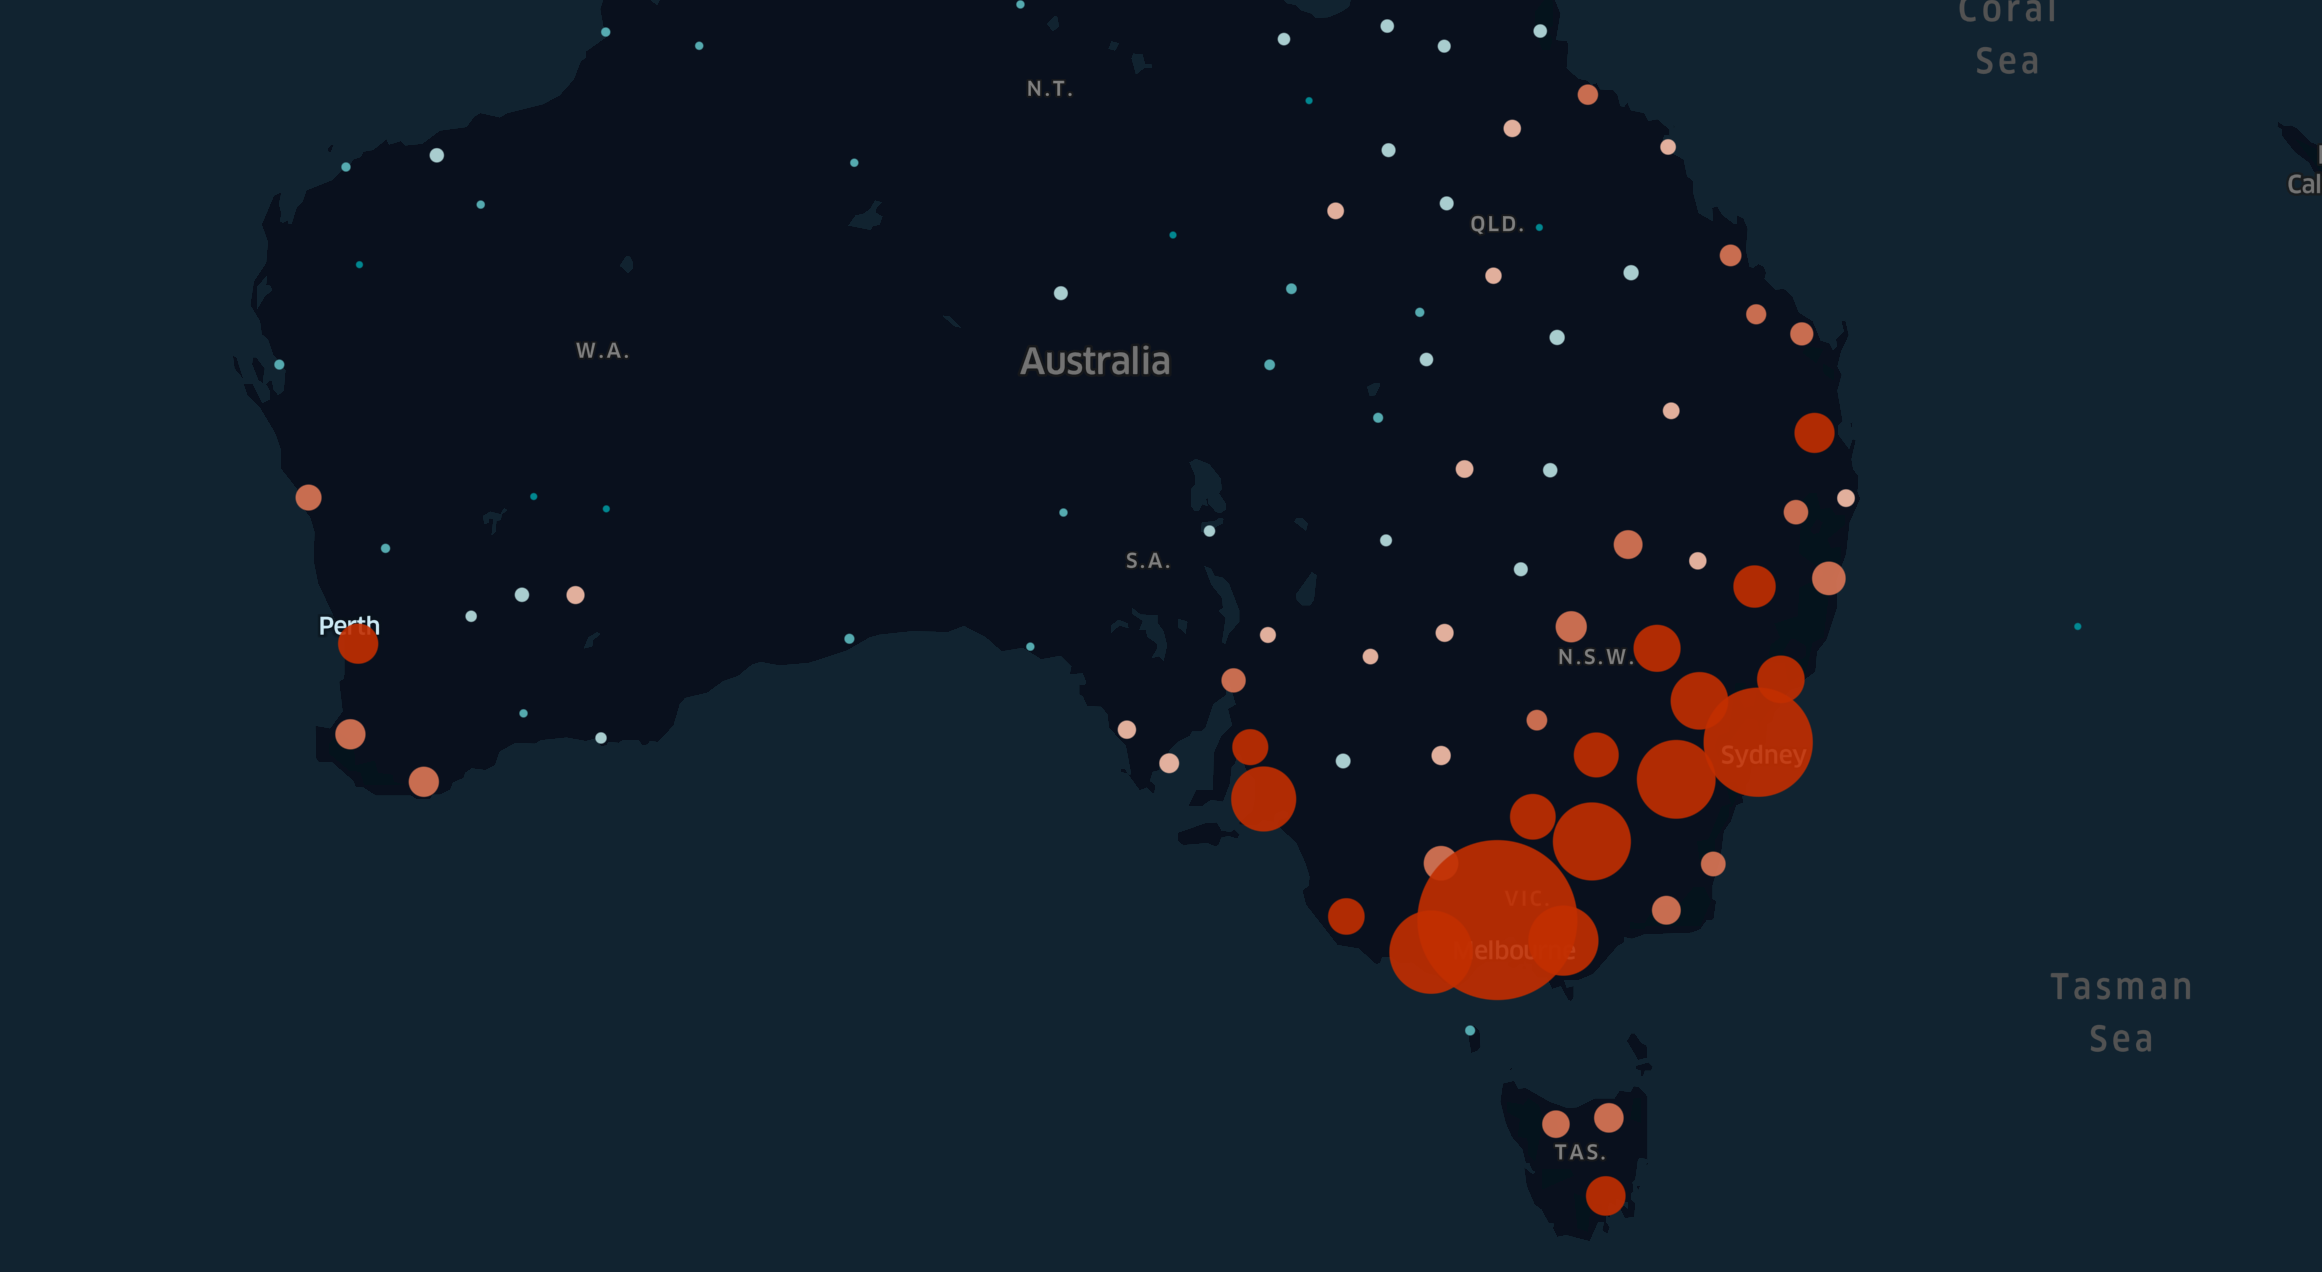
Fig. 4 Bushfire Cluster Map#